How can I support your projects?
Here are some ideas of what type of services I can provide (always with some concrete examples in grey). These are just ideas and you can combine them all together (e.g., using online databases, processing them in a GIS analyses, and display results interactively) and many more things are possible. If you have a particular need and are unsure whether I can do it, just ask me via email!
Online databases
I can help access and use data from online databases on biodiversity or habitat. I can access data from GBIF, OBIS, eBird, or iNaturalist to gather information on a given site or a given species. I can also access and process different habitat layers to get context information on the sites you are working on: land-cover, forest cover, human density, road density, protected areas, and so on.
You are working in a protected area and want a list of species found within your border → I can extract data from GBIF (or other databases) and give you a spreadsheet with species name, number of occurrences, site, and additional information.
You are working on an invasive species → I can extract data from online databases to enable you mapping and analysing the distribution and spread of your species.
Interactive data visualisation
Interactive data visualisation is probably the best way to make informed decision in conservation. Being able to explore a map, click on a given sites to see the species occurring there, or clicking on a given species to understand its conservation needs will help you prioritise your actions. A big asset of interactive data visualisation is also that it is a good communication tool with people with little to no scientific background. The two main interactive tools I use are interactive reports and interactive apps.
Interactive reports
Using RMarkDown, I can create interactive reports (pdf or html) that include graphics, results of spatial analyses, and interactive maps. The strength of this tool is that it enables making individual reports with a common structure but different content. For instance, if you need to describe the habitat characteristics and monitoring results of 50 sites, you can get 50 individual reports with in-depth results on each site. You can see an example of such report here, describing data on a species to apply Red List criteria.
This tool will be well suited if you need to visualise data and analyses results for a large but reasonable number of species or sites (ideally 10-100). It is also very convenient to share with different experts!
You are working on a biodiversity atlas and want to provide some data visualisation and analyses to your species experts → I can create individual reports for each species that will display the occurrences and analyse results; each expert will then get a standard report on their species to easily inform their species monography.
You are working in a protected area and need to map some habitat or protection measures for each municipality included in your protected area → I can create individual report for each municipality that you can share with each municipality representatives. It can include interactive habitat maps, list of species occurring in the municipality, statistical analyses focusing on that municipality, a text summary of conservation actions and monitoring within the municipality…
Interactive apps
Using R Shiny Apps, I can create and host online applications that can include interactive maps, graphics, text, and tables. The strength of this tool is that users can set parameters they are interested in, and run analyses just by clicking on a button. You can see an example here. This tool can also allow users to enter data themselves (either to use in the analyses or to populate a database) or to manually classify or annotate data.
It is a very powerful tool when you need to interact a lot with your data or when you want the tool to be accessible to many people.
You are coordinating a conservation project and want every stakeholder to access and explore the project data → I can create an online app to visualise your different data products (maps, graphics, tables…) and create adequate documentation (text, cheatsheet, video tutorial) for your users.
You are coordinating a team of fieldworkers and need an online portal for them to enter their data interactively (e.g., enter point data directly from an interactive map) or to annotate data (e.g., assess local conservation status based on graphics) → I can create an online app that your team can use to enter data when they are coming back from fieldwork and create a robust database.
Maps and graphics
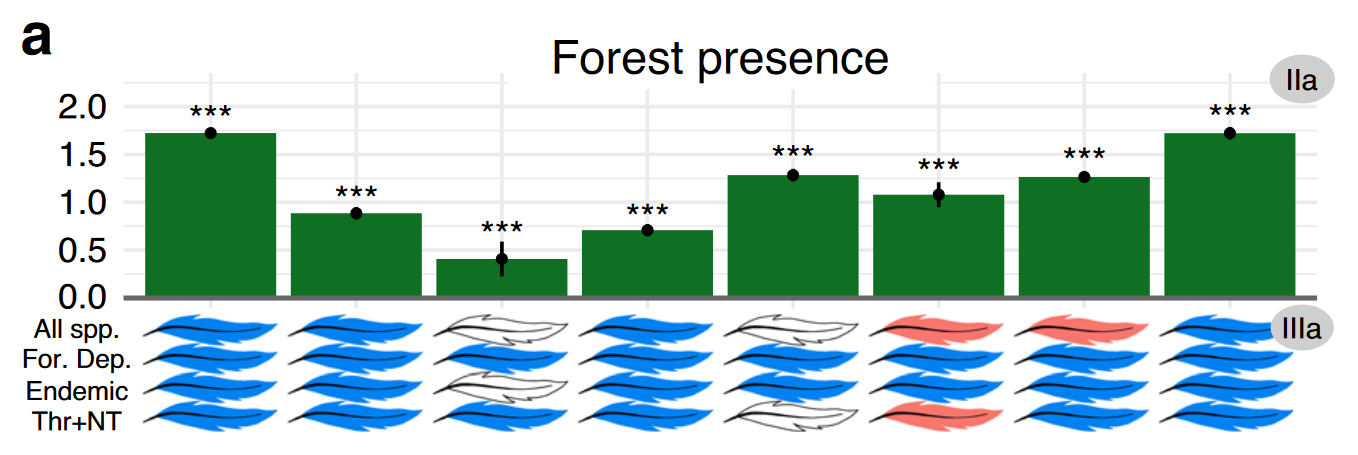
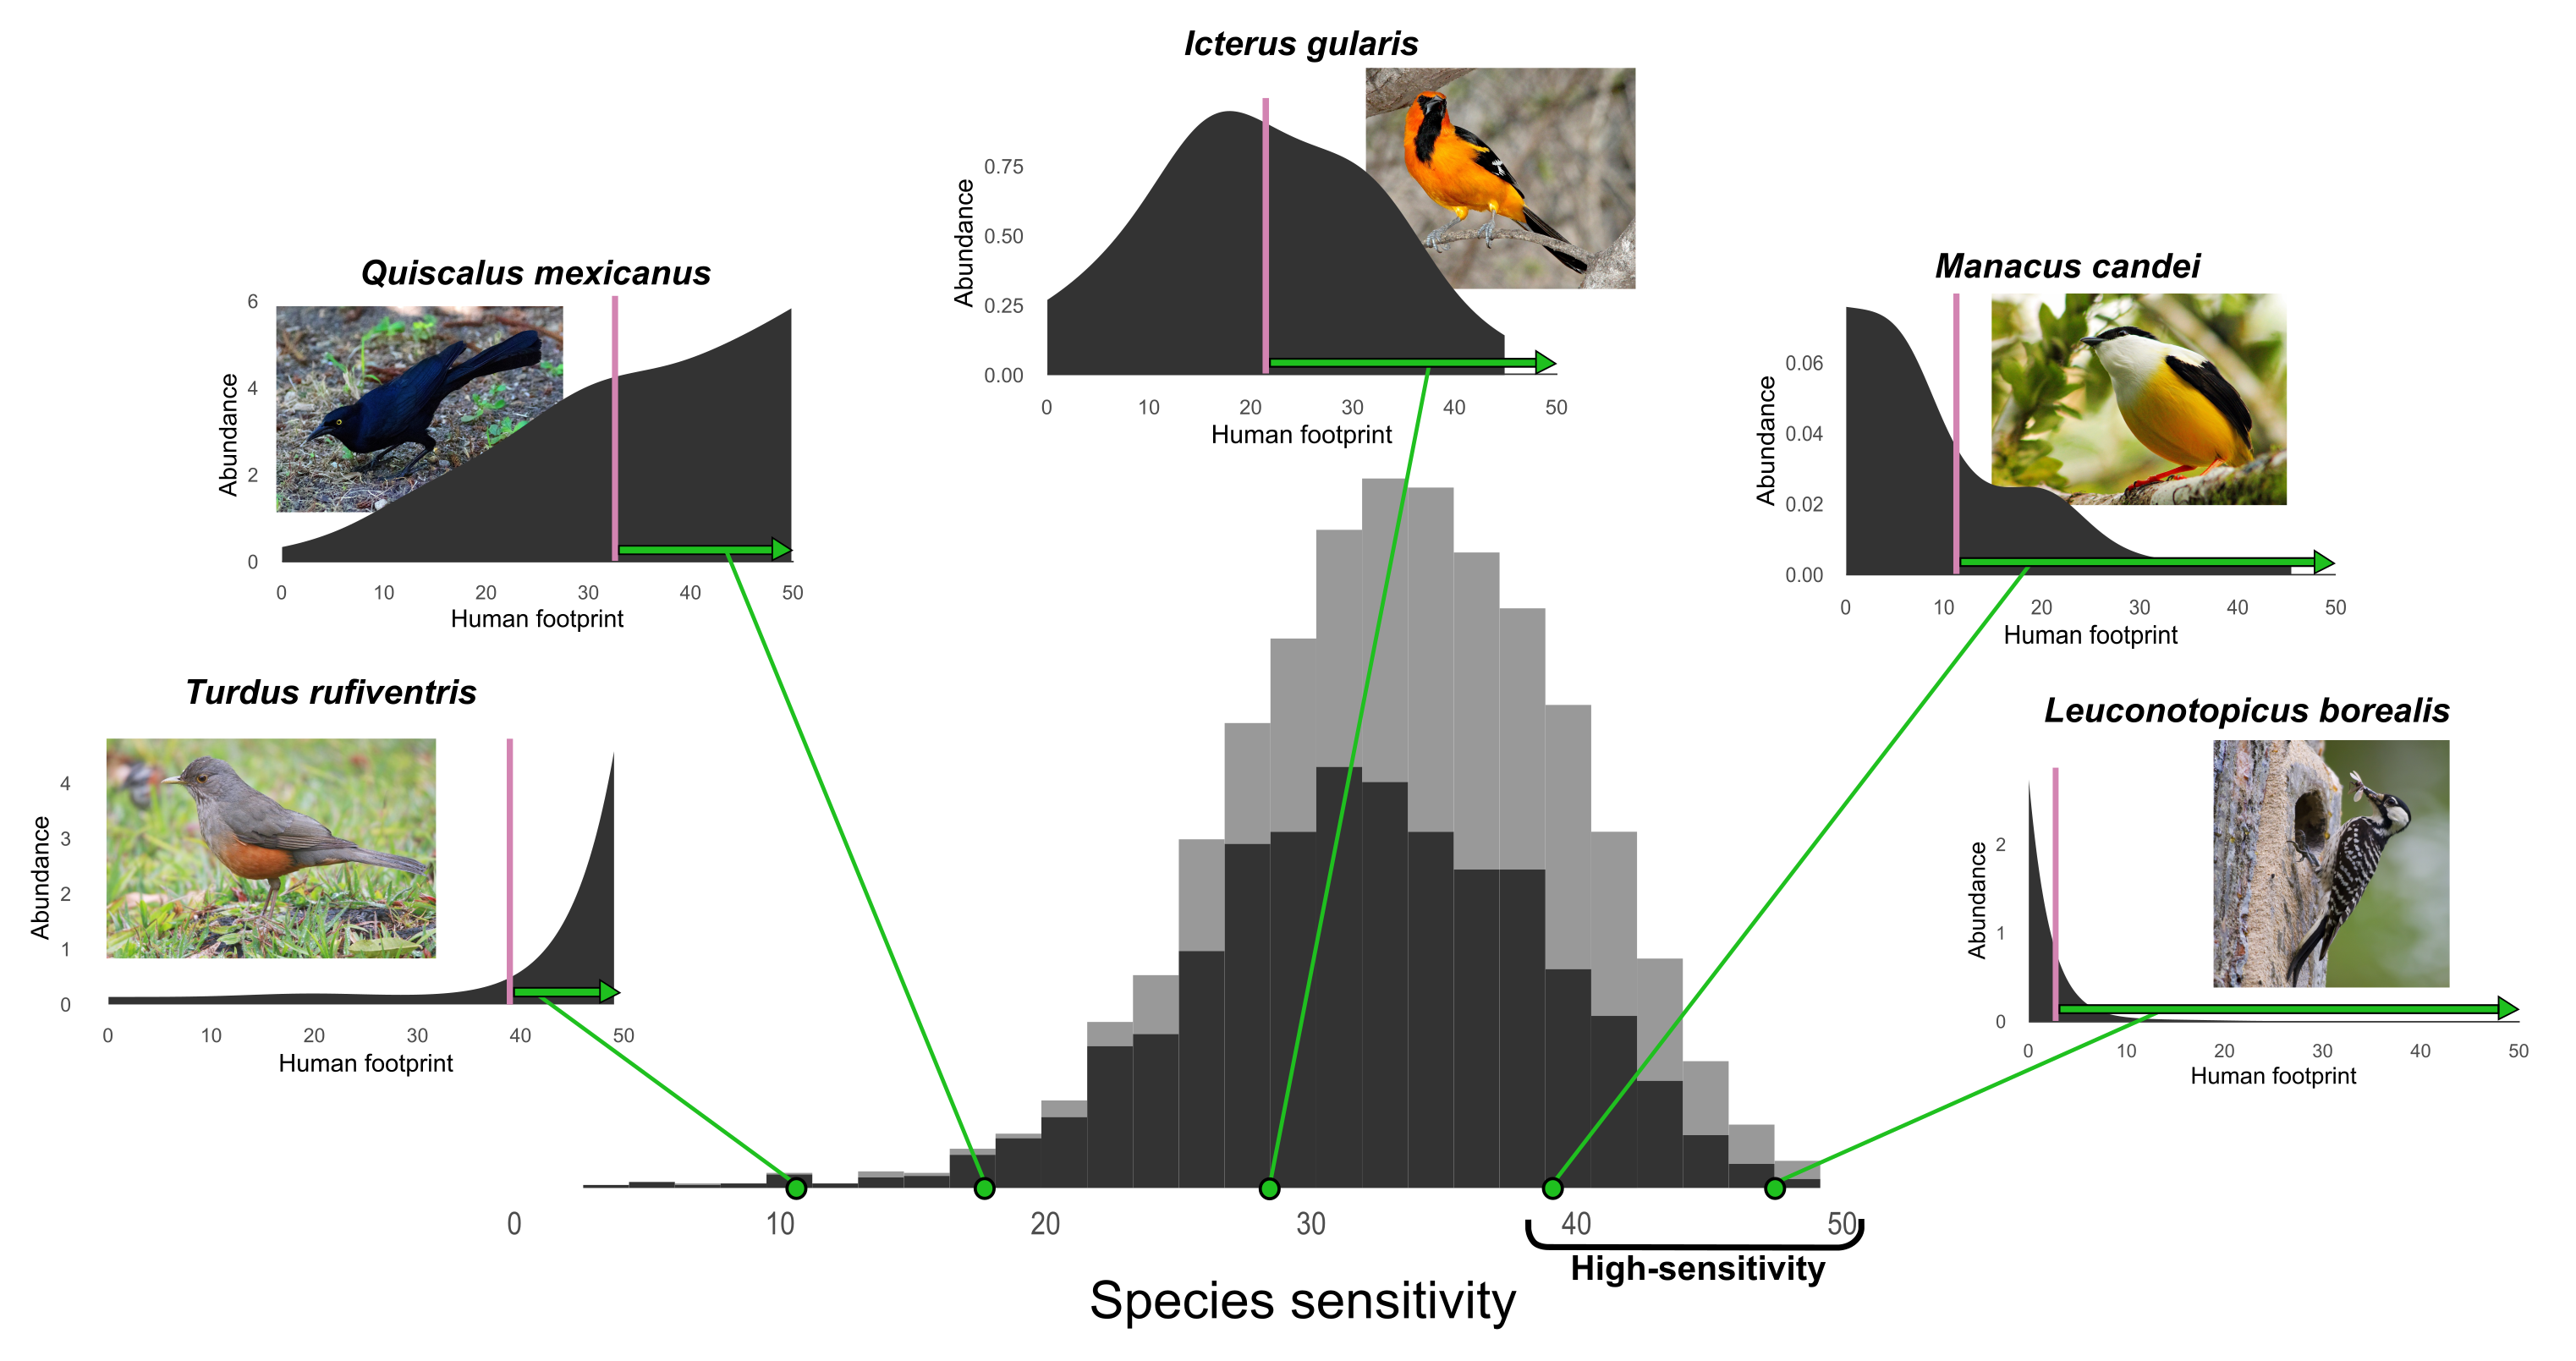
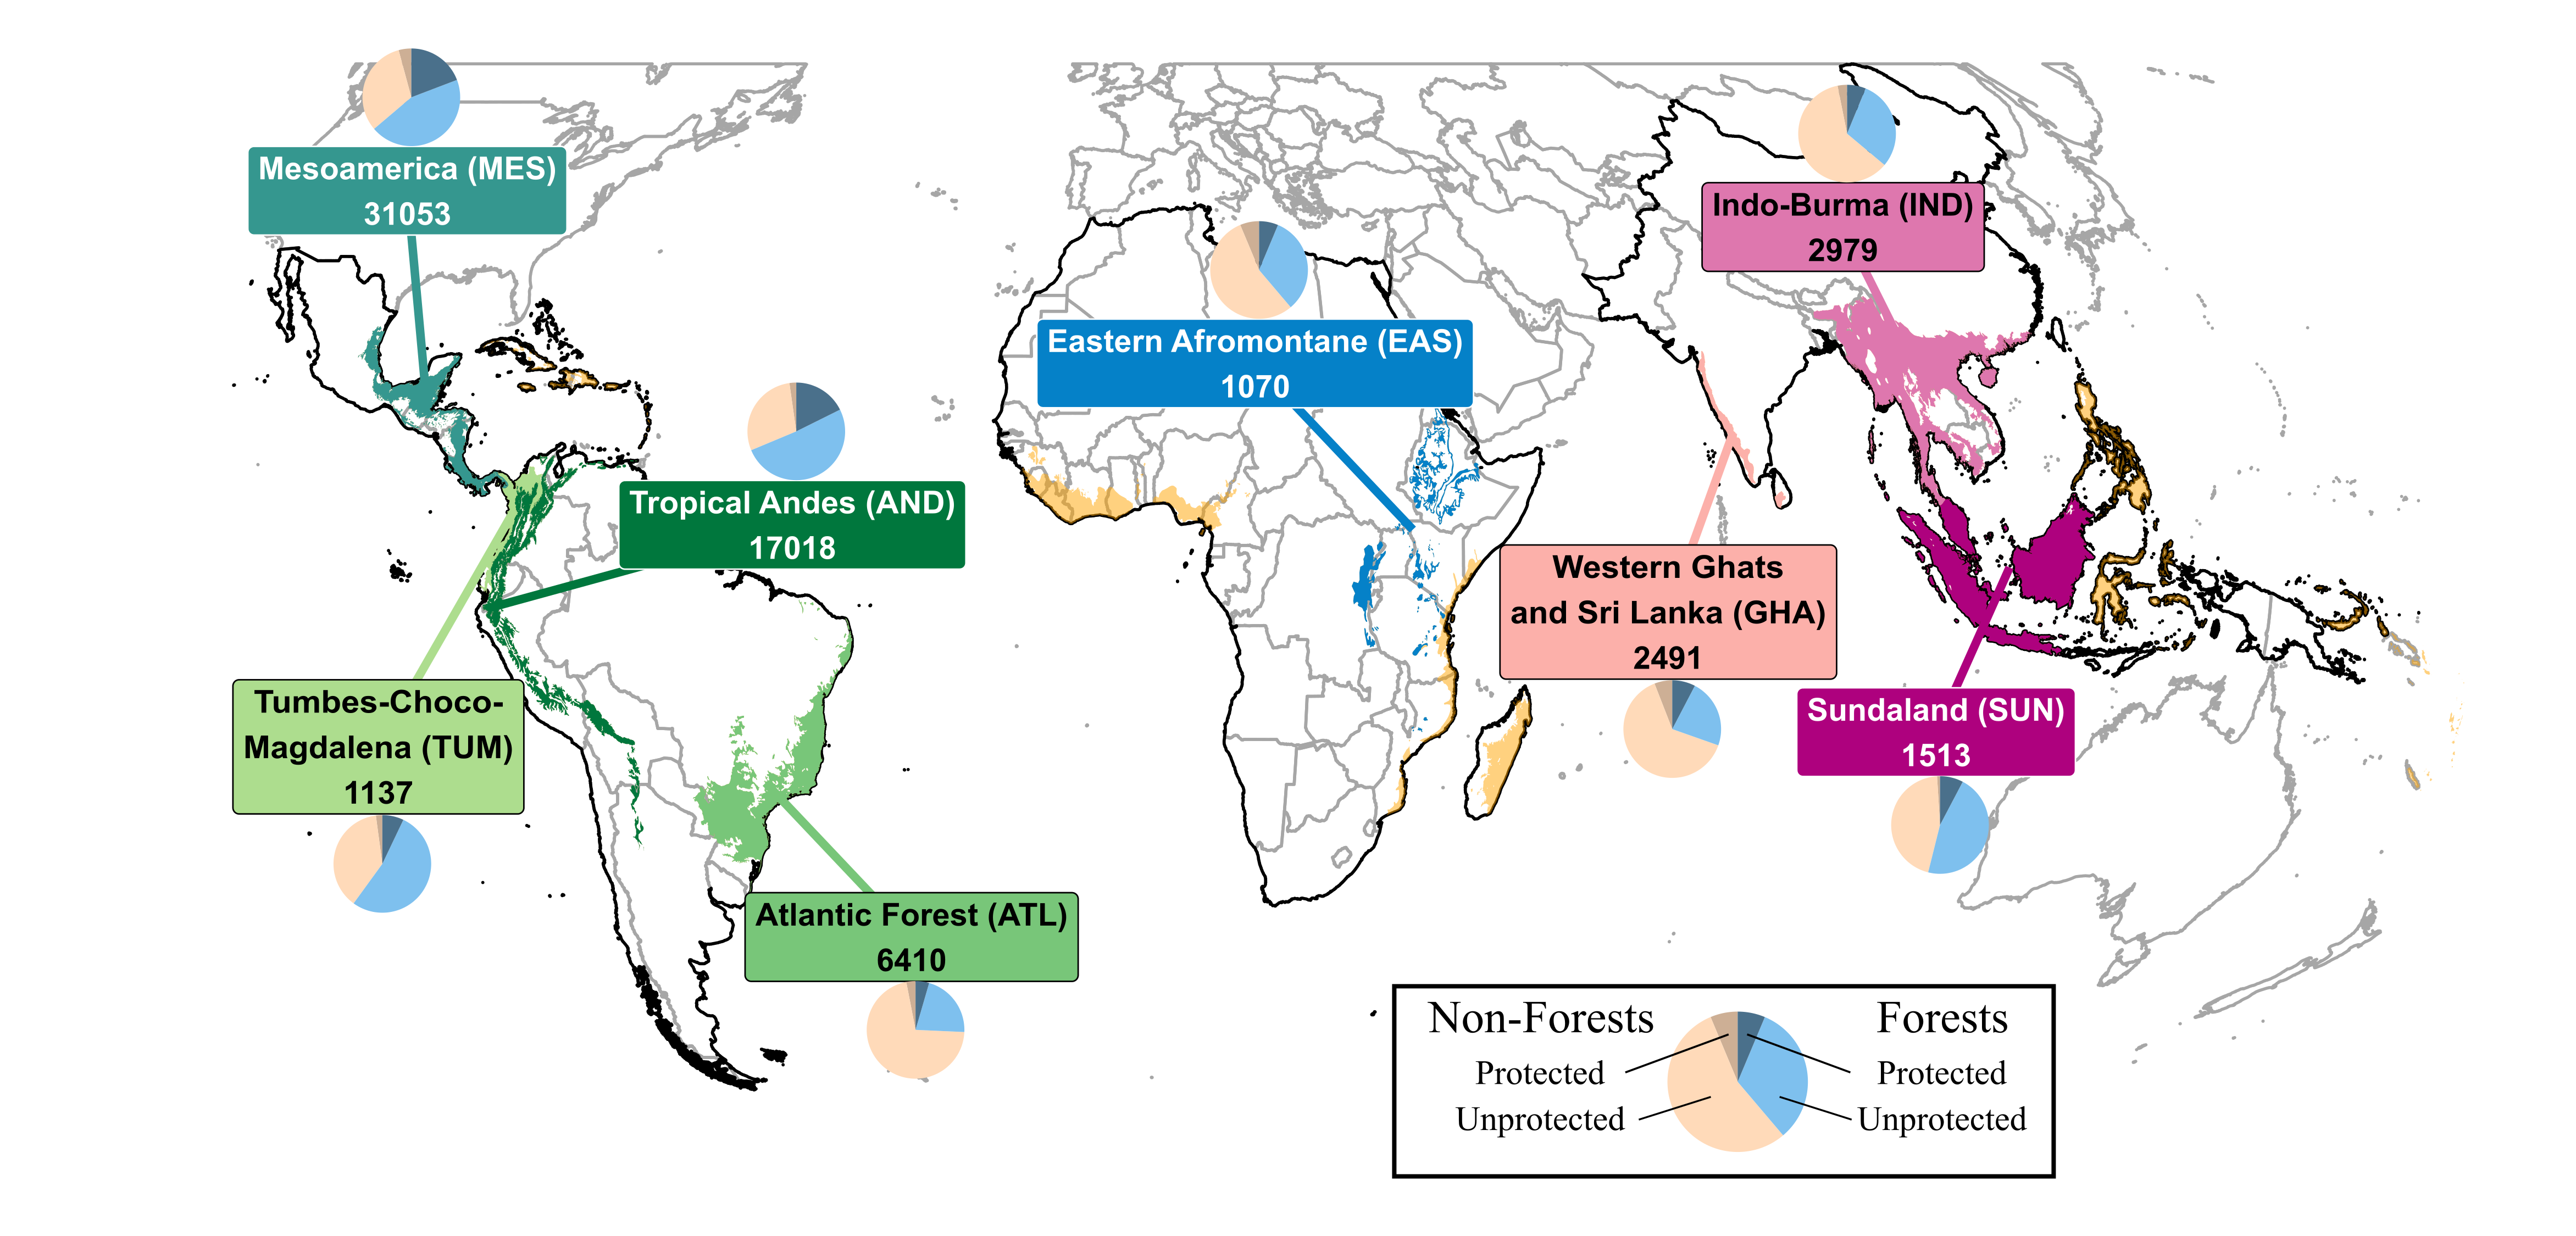
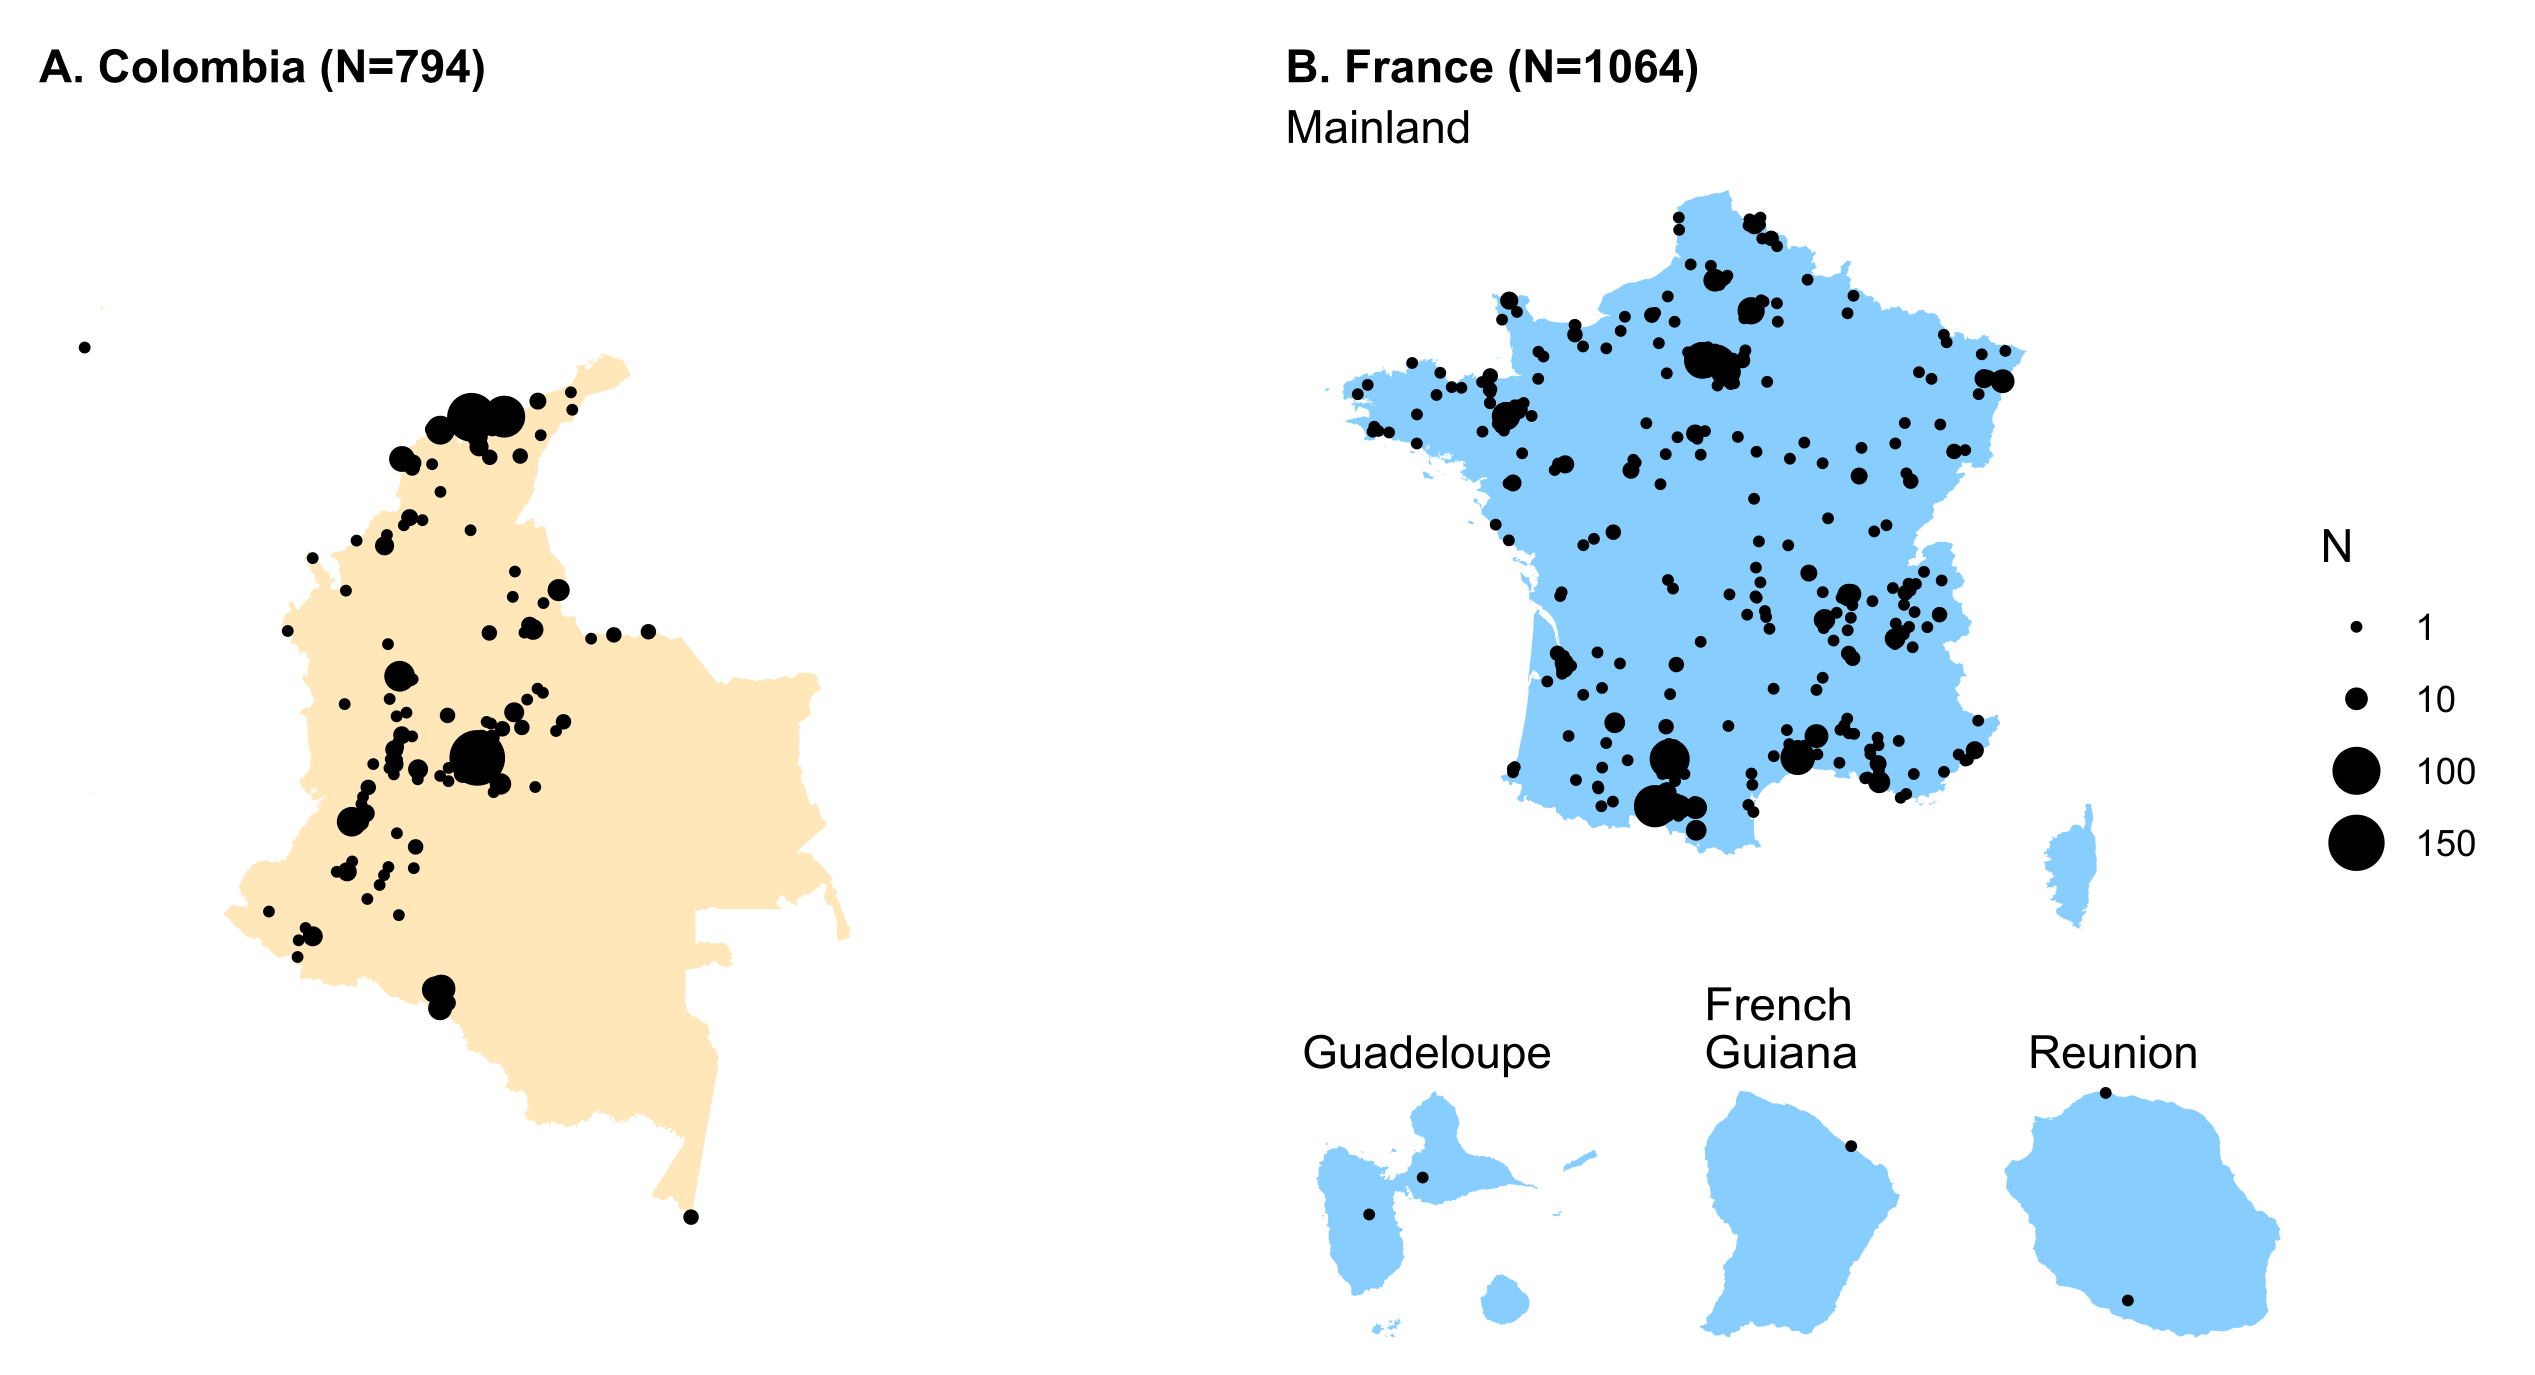
Combining R and Inkscape, I create maps and graphics to display results in a pretty and informative way. Here are a few examples of graphical outputs from my research projects:
You are running a conservation program and need to present complex results in a report or website → I can analyse the data and display the results nicely.
You need a pretty and informative map of your protected area (including some graphics and pictures) → I can design it for you.
GIS analyses
Each of my research project included some GIS analyses. I run any GIS analysis in R, which enables to process large datasets in a standard and reproducible way. I can develop R codes to do anything you need with polygon and rasters data. For instance, I can run any of the following analyses and use the results in any statistical analysis or data visualisation possible:
- assign point data to different polygons (e.g., to identify in which “region” falls each point)
- intersect different polygons (e.g., to identify the different protected areas overlapping with a given polygon)
- calculate raster values within different polygons (e.g., to calculate forest cover trends within each protected area)
- create polygons from points (e.g., to map the distribution of a given species)
- calculate distance between polygons and raster values (e.g., to calculate the distance from any point or polygon to the closest human settlement)
- create rasters (e.g., transforming a polygon map of lakes in a region to a raster of distance to lakes) You can see more options of what is possible for instance in the R sf cheatsheet.
You need to calculate different characteristics of the lakes across your protected area → I can calculate multiple characteristics for each lake (e.g., size, elevation, forest cover, distance to human activities, level of protection, number of species recorded in a buffer of 5 km…).
You need to elaborate a sampling strategy → I can use different spatial information (habitat, elevation, protected areas, human activities…) to identify the best sampling sites.
You are working on a restoration project and need to identify 10 sites in a given region where to prioritize your efforts → I can use geographical data on species distribution, habitat, human pressure, and protection to identify sites that would be the best suited for restoration efforts.
Statistical analyses
I can help you explore your data, find the correct statistical analyses to implement, and run a wide diversity of statistical analyses.
I can for instance help with:
- Generalised Linear Models
- Mixed effect models
- Distance sampling and site occupancy models
- Multivariate analyses (PCAs, factorial analyses…)
- Random Forest algorithms
You are monitoring a species within your region → I can analyse your raw data to estimate population trends.
You need to identify what limits the presence of your target species → I can use site occupancy models to model and understand the effect of habitat, human activities, or climate on the occurrence of your species.
Database management
I can help you to create or manage a biodiversity database for your structure. I can help design the structure, code ways to populate the database, code ways to review the database and spot possible errors, or code ways to access and use data from it.
Your structure stored many observations that are difficult to access and use → I can merge them in a standard dataset that will be easy to use.
You have an old database that needs to be filtered and transform → I can address the problems your current database has (e.g., identify data with wrong coordinates, harmonise species names…) and transform it to a clean dataset.